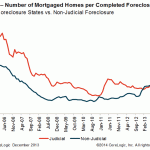
There were 620,111 completed foreclosures across the country in 2013 compared to 820,498 in 2012, a decrease of 24 percent. For the month of December, there were 45,000 completed foreclosures, down from 52,000 in December 2012, a year-over-year decrease of 14 percent, according to CoreLogic. Completed foreclosures are an indication of the total number of homes actually lost to … Read More »
Housing Data
Case-Shiller: Dallas, Chicago Broke Records in November
Data through November 2013 showed that the 10-City and 20-City Case-Shiller Composites increased 13.8% and 13.7% year-over-year. Dallas posted its highest annual return of 9.9% since its inception in 2000. Chicago also stood out with an annual rate of 11.0%, its highest since December 1988. For the month of November, the two Composites declined 0.1%. After nine consecutive months of … Read More »
Thirty Somethings Flip-Flopped on Homeownership
An analysis by Chris Porter, a senior manager at the John Burns Real Estate Consulting practice, has some frightening findings for the housing industry. Americans aged 30 to 34 years old in 2012 had the lowest homeownership rate of any similarly aged group before them… yet just five years earlier, in 2007, the same people had the highest homeownership rate … Read More »
Case-Shiller: October Price Increases Reach 13.6 Percent Year-over-year
Prices on both S&P/Case-Shiller Home Price Indices reached their highest year-over-year gain in nearly eight years in October as they rose 0.2 percent over September. It was the seventeenth consecutive month that both the 10 and 20-city indexes increased on an annual basis. Read More »
Prices Rose 12 Percent in April
| Home prices nationwide, including distressed sales, increased 12.1 percent on a year-over-year basis in April 2013 compared to April 2012. This change represents the biggest year-over-year increase since February 2006 and the 14th consecutive monthly increase in home prices nationally. On a month-over-month basis, including distressed sales, home prices increased by 3.2 percent in April 2013 compared to March 2013*, according to the April CoreLogic HPITM report. |
Agents More Bullish on Prices than Sales
Real estate professionals are more optimistic that prices will increase this year than they were last year, but they’re less enthusiastic about the outlook for sales increases in 2013 than they were in 2012. Read More »
Recovery Softens as More Markets End Year with Annual Price Decline
Over the past few months, the number of markets experiencing year-over-year price declines has steadily increased, while the number experiencing list price increases has steadily declined. Compared to one year ago, a higher number of markets are ending the year with a year-over-year price decline (44 in 2012 vs. 36 in 2011) and a lower number of markets have a year-over-year price increase (71 in 2012 vs.84 in 2011). Read More »
Down Payments Fall to Three Year Low
The median downpayment made by all homebuyers in 2012 was 9 percent, ranging from 4 percent for first-time buyers to 13 percent for repeat buyers. The median down payment was the lowest since 2009 but still far above the levels during the housing boom, when nearly half of first-time buyers made no downpayment at all. Read More »
Case-Shiller Composites Sank to New Lows in Q1
All three headline Case-Shiller composites fell to new post-crisis lows in the first quarter of 2012, wiping out all price gains realized since prices peaked in 2006, a decline of approximately 35 percent through March 2012. Read More »
RE/MAX: April Sales up 4.1 Percent
Closed sales were 4.1 percent higher in April than a year earlier, continuing a ten month run of year-over-year sales increases in the 53 markets tracked by the RE/MAX National Housing Report. Read More »
 RealEstateEconomyWatch.com Insight and Intelligence on Residential Real Estate


