Want to know what home values in your market will probably look like next July?
Here are 17 digital maps from the 100 million house database created by Allan Weiss, former CEO of Case Shiller Weiss. Each house is a repeat sales index, which enables each index to anticipate values accurately up to 12 months in the future.
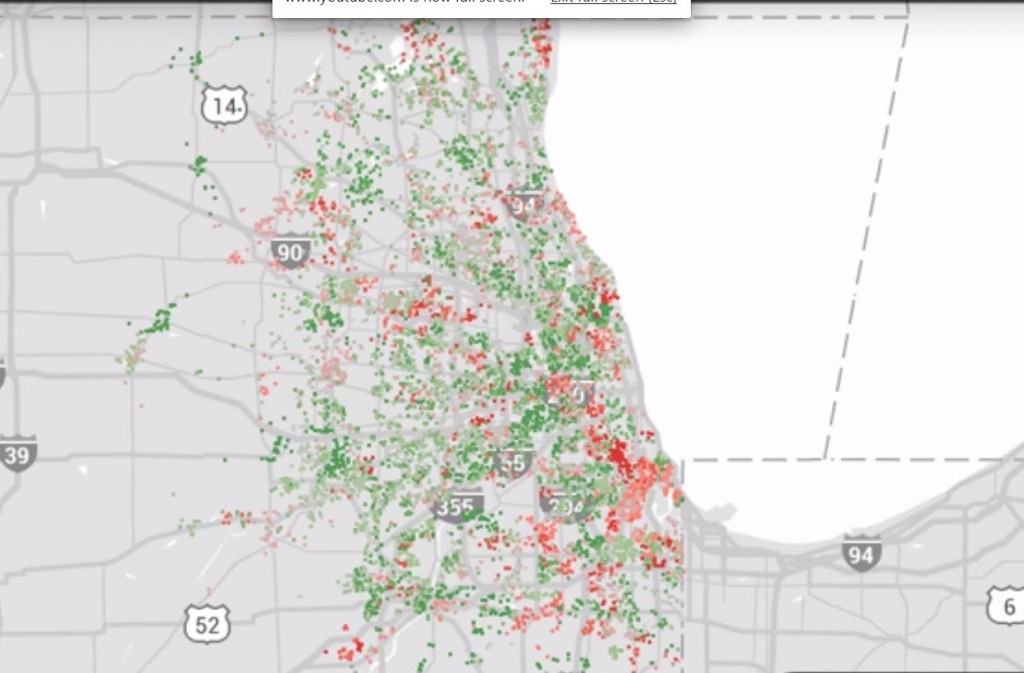
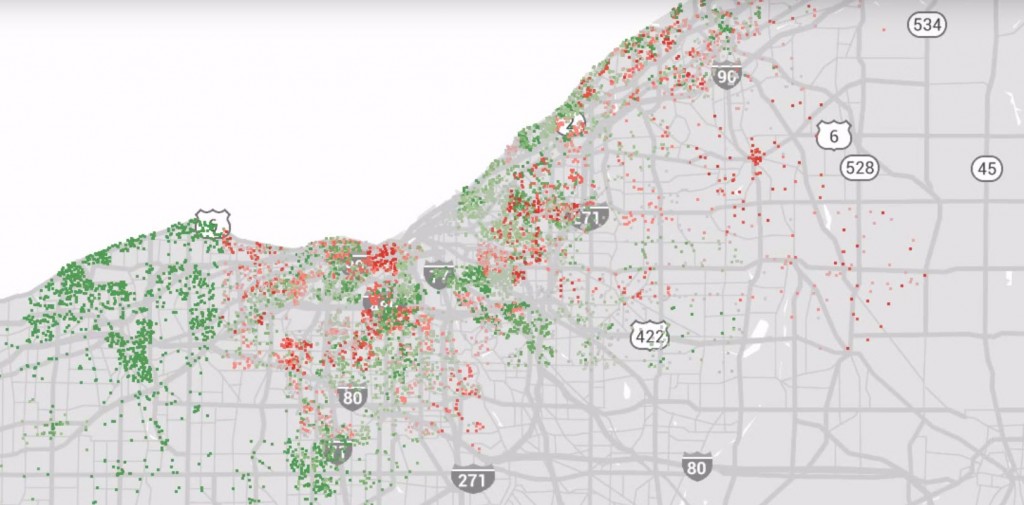
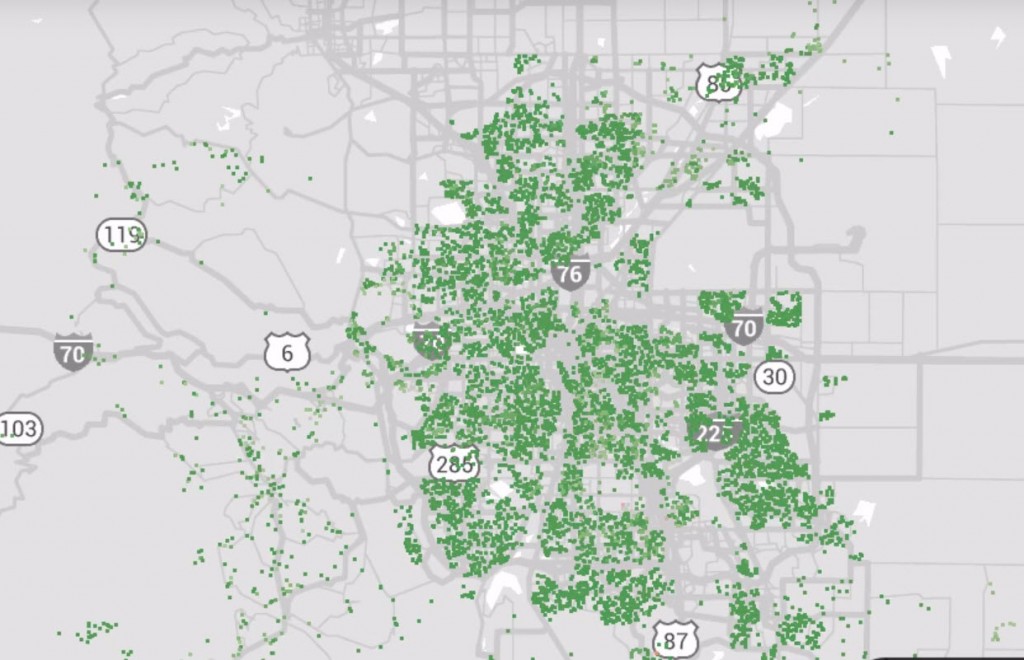
The colors represent month-over-month trends. Red indicates depreciation, green appreciation and gray neutral.
A full set of 90 metros and 5500 Zip codes can be found on Weissindex.com and Owners.com. Dynamic maps on the sites begin in 2006 and show changing values a month at a time.
Copyright Weiss Residential Research LLC. Provided by Owners.com. Forecasted values have a margin of error of 3 ½ percent.
Atlanta July 2016
Chicago July 2016
Cleveland July 2016
Denver July 2016
Detroit July 2016
Las Vegas July 2016
Los Angeles July 2016
Miami July 2016
Minneapolis July 2016
New York City July 2016
Philadelphia July 2016
Phoenix July 2016
San Diego July 2016
San Jose July 2016
San Francisco July 2016
Seattle July 2016
Washington DC July 2016
2 comments
Pingback: Weiss Forecast Maps of Top Markets | Belair Realty
Pingback: Forecasted Values in 17 Top Markets on Weiss Maps | Belair Realty