Prices in the year to come are going to be a lot worse than most earlier forecasts, according to Clear Capital’s view of the market, which refuses to “sugarcoat the data”. The provider of real estate valuations, data and analytics calls for continued market instability and a trend of decreasing rates over the next 12 months, especially in mid tier homes.
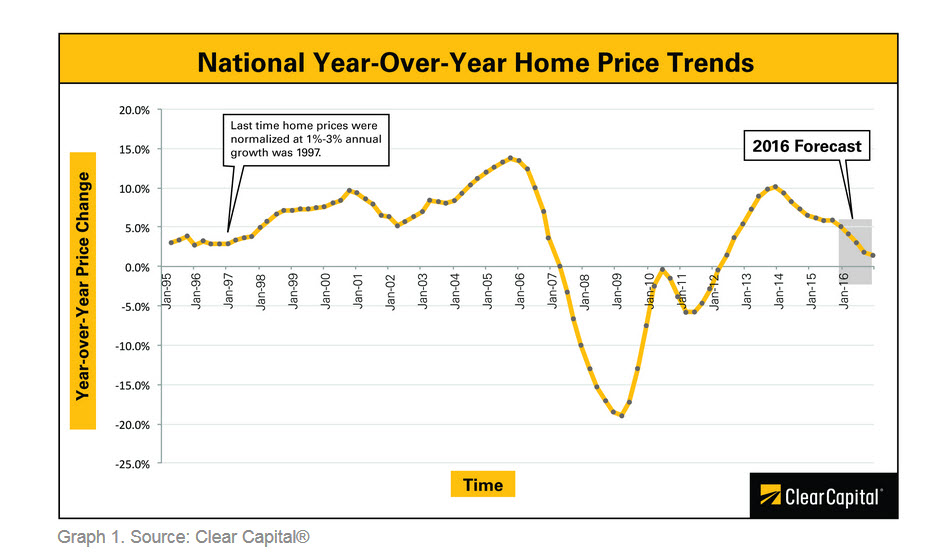
The overall Clear Capital® Home Data Index™ (HDI™) forecasts 2016 home price appreciation will be in the range of 1 percent to 3 percent, significantly lower than the 5.1 percent growth rate during 2015 and the 6.6 percent growth rate in 2014, demonstrating continued market instability and a trend of decreasing rates.
Most other forecasts, including Fannie Mae and Freddie Mac, have called for a modest decline in price appreciation in 2016, to 3 to 4.5 percent.
“While we would love to sugarcoat the HDI data and declare that 2016 merely will be a normalization of the housing market to historical averages not seen since the late 1990s, several factors indicate that it could be another volatile year leading to ongoing uncertainty about the future of American housing,” says Alex Villacorta, Ph.D., vice president of research and analytics at Clear Capital.
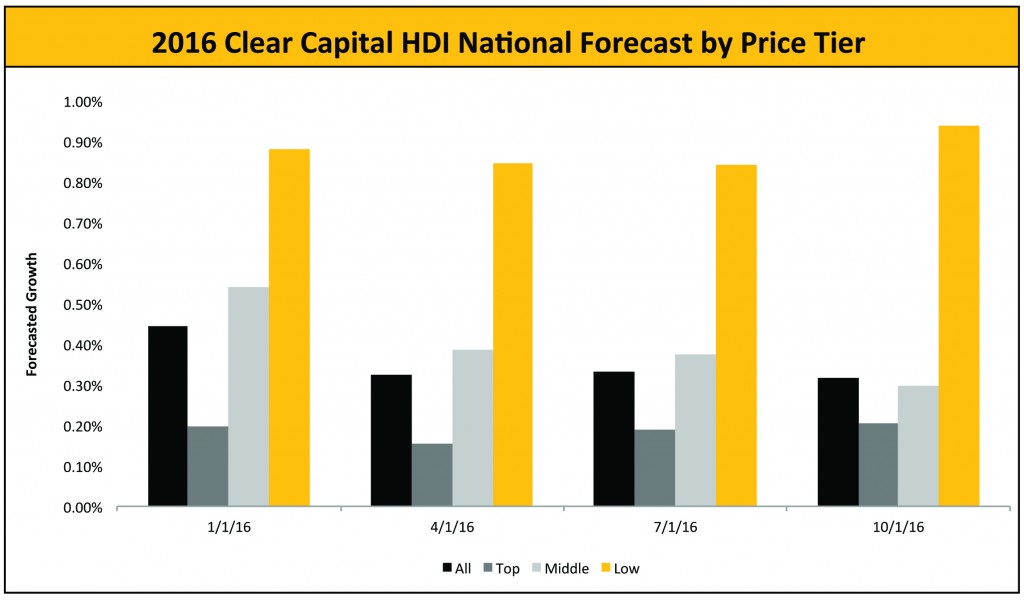
Ultimately, overall national growth will be positive throughout 2016, but these rates are underwhelming and signal the end of the explosive growth typical of the first half of this decade. The forecast is predicting an average of only 0.4 percent quarter-over-quarter (QoQ) growth for each quarter during 2016. Growth in this range is rather lackluster when compared to the previous two years, when home prices grew by an average of 1.5 percent quarterly over the period from January 2014 to January 2016.
Homes in the low tier (selling below $116,000 nationwide) are forecasted to appreciate more significantly than other tiers during the next year, averaging just under 1.0 percent quarterly growth throughout 2016. By definition, the low tier is affordable to the widest range of potential homeowners and investors. This larger class of buyers will likely cause continued higher appreciation for the country’s most affordable home tier.
The overall trend of decreasing rates of growth during 2016 will primarily affect the middle price tier—representing the middle 50 percent of all transactions, currently comprised of homes selling between $116,000 and $337,500 nationwide. While growth in the middle price range is not projected to be the lowest of all the price tiers, the mid tier shows a consistent decrease in quarterly growth over the forecast period, falling from 0.5 percent QoQ growth in January 2016 to just under 0.2 percent QoQ by the end of the year.
Conversely, the top price tier (homes selling above $337,500 nationwide) forecasts relatively consistent quarterly growth, hovering around the 0.2 percent QoQ mark. Historically, pricing in this class of homes has moved slowly in the sense that gains and losses both have been smaller by percentage due to higher initial prices. The contrast to the low tier highlights the diversity in performance that remains in today’s real estate market.
Generally, year-over-year growth rates are forecasted to be lower for all MSAs in the nation, with no exceptions . The highest growth in 2016 is forecasted to occur in Denver, where home prices are projected to grow by 7.7 percent during the course of the upcoming year, compared to the 11.7 percent annual growth seen in 2015.
While slower growth plagues the forecasts of all major cities across the nation, the luxury markets are among the hardest hit. Miami and San Jose are projected to grow by only 1.3 percent and 1.4 percent respectively during 2016, after each MSA saw market growth in excess of 10% during 2015. Other cities like Chicago, New York, and San Francisco are forecasted to see significant changes to their 2015 performance, with little to no growth for the upcoming year.
Home price appreciation in Detroit, which saw an uncharacteristic increase in QoQ growth toward the end of 2015, is forecasted to fall 5.8 percent over the course of 2016. This is compared to annual growth in excess of 11 percent in 2015, making Detroit one of the hardest-hit MSAs of the forecast. Since May 2013, the Detroit MSA has seen declining quarterly gains in 9 of 10 quarters, with the most recent quarter less than half of the Q3 2015 market performance. Based on this rapidly decelerating rate of price growth, it is quite possible this metro turns negative by year end.
| Top 50 Performing Major Metro Markets | |||||||||||
|
Rank |
Metropolitan Statistical Area |
Qtr/Qtr % +/- |
Yr/Yr |
Distressed Saturation |
2015 Forecast |
||||||
|
1 |
DENVER-AURORA, CO |
1.5% |
11.7% |
6.0% |
7.7% |
||||||
|
2 |
DALLAS-FORT WORTH-ARLINGTON, TX |
1.1% |
9.4% |
2.9% |
7.1% |
||||||
|
3 |
JACKSONVILLE, FL |
0.9% |
7.5% |
28.3% |
5.0% |
||||||
|
4 |
NASHVILLE-DAVIDSON-MURFREESBORO, TN |
1.2% |
7.5% |
9.2% |
4.9% |
||||||
|
5 |
LAS VEGAS-PARADISE, NV |
0.9% |
8.9% |
17.7% |
3.9% |
||||||
|
6 |
COLUMBUS, OH |
0.9% |
6.2% |
16.6% |
3.7% |
||||||
|
7 |
CHARLOTTE-GASTONIA-CONCORD, NC-SC |
0.5% |
7.2% |
9.5% |
3.5% |
||||||
|
8 |
HOUSTON-BAYTOWN-SUGAR LAND, TX |
1.0% |
8.6% |
3.4% |
3.4% |
||||||
|
9 |
TAMPA-ST.PETERSBURG-CLEARWATER, FL |
1.2% |
9.8% |
27.1% |
3.4% |
||||||
|
10 |
ATLANTA-SANDY SPRINGS-MARIETTA,GA |
1.2% |
8.6% |
15.9% |
3.2% |
||||||
|
11 |
CLEVELAND-ELYRIA-MENTOR, OH |
1.7% |
4.6% |
17.7% |
3.2% |
||||||
|
12 |
RALEIGH-CARY,NC |
0.7% |
4.6% |
17.7% |
3.2% |
||||||
|
13 |
CINCINNATI-MIDDLETOWN, OH-KY-IN |
0.7% |
4.0% |
17.8% |
3.2% |
||||||
|
14 |
ORLANDO, FL |
1.0% |
8.9% |
26.6% |
2.9% |
||||||
|
15 |
BOSTON-CAMBRIDGE-QUINCY, MA-NH |
1.2% |
4.2% |
8.0% |
2.7% |
||||||
|
16 |
RICHMOND, VA |
0.5% |
4.9% |
14.8% |
2.4% |
||||||
|
17 |
SEATTLE-TACHOMA-BELLEVUE, WA |
1.4% |
10.3% |
10.3% |
2.1% |
||||||
|
18 |
MILWAUKEE-WAUKESHA-WEST ALLIS, WI |
0.6% |
4.7% |
15.6% |
2.1% |
||||||
|
19 |
NEW ORLEANS-METAIRIE-KENNER, LA |
0.5% |
4.5% |
19.5% |
1.9% |
||||||
|
20 |
HONOULU, HI |
0.4% |
4.8% |
8.0% |
1.9% |
||||||
|
21 |
DAYTON, OH |
0.7% |
4.1% |
19.0% |
1.9% |
||||||
|
22 |
ST. LOUIS, MO-IL |
0.6% |
5.7% |
17.1% |
1.9% |
||||||
|
23 |
HARTFORD-WEST HARTFORD-EAST HARTFORD, CT |
0.7% |
2.8% |
17.0% |
1.5% |
||||||
|
24 |
SAN JOSE-SUNNYVALE-SANTA CLARA, CA |
1.3% |
10.2% |
3.9% |
1.4% |
||||||
|
25 |
MIAMI-FORT LAUDERDALE-MIAMI BEACH, FL |
1.3% |
10.4% |
24.1% |
1.2% |
||||||
|
26 |
RIVERSIDE-SAN BERNADINO-ONTATIO, CA |
0.8% |
6.0% |
12.8% |
1.1% |
||||||
|
27 |
MEMPHIS, TN-MS-AR |
0.6% |
0.8% |
26.8% |
1.0% |
||||||
|
28 |
BIRMINGHAM-HOOVER, AL |
0.3% |
2.7% |
15.9% |
0.9% |
||||||
|
29 |
OXNARD-THOUSAND OAKS-VENTURA, CA |
0.7% |
4.4% |
7.6% |
0.9% |
||||||
|
30 |
VIRGINIA BEACH-NORFOLK-NEWPORT NEWS, VA-NC |
0.0% |
2.2% |
19.1% |
0.9% |
||||||
|
31 |
PORTLAND-VANCOUVER-BEAVERTON, OR-WA |
1.5% |
9.5% |
9.3% |
0.8% |
||||||
|
32 |
SACRAMENTO-ARDEN-ARCADE-ROSEVILLE, CA |
1.2% |
8.3% |
11.2% |
0.6% |
||||||
|
33 |
ROCHESTER, NY |
-0.1% |
1.0% |
11.6% |
0.5% |
||||||
|
34 |
SAN DIEGO-CARLSBAD-SAN MARCOS, CA |
0.9% |
6.4% |
9.0% |
0.5% |
||||||
|
35 |
BALTIMORE-TOWNSON, MD |
0.3% |
0.3% |
24.7% |
0.3% |
||||||
|
36 |
LOS ANGELES-LONG BEACH-SANTA ANA, CA |
0.9% |
7.3% |
8.9% |
0.2% |
||||||
|
37 |
PHILADELPHIA-CAMDEN-WILMINGTON-PA-NJ-DE-MD |
0.2% |
2.3% |
17.3% |
0.1% |
||||||
|
38 |
SAN FRANCISCO-OAKLAND-FREMONT-CA |
0.8% |
8.0% |
6.5% |
-0.3% |
||||||
|
39 |
CHICAGO-NAPERVILLE-JOLIET, IL-IN-WI |
0.8% |
6.2% |
24.3% |
-0.3% |
||||||
|
40 |
BAKERSFIELD, CA |
0.6% |
5.3% |
14.6% |
-0.4% |
||||||
|
41 |
MINNEAPOLIS-ST. PAUL-BLOOMINGTON, MN-WI |
0.6% |
5.4% |
8.8% |
-0.4% |
||||||
|
42 |
TUCSON, AZ |
0.4% |
4.6% |
16.3% |
-0.6% |
||||||
|
43 |
NEW YORK-NORTHERN NEW JERSEY-LONG ISLAND, NY-NJ-PA |
0.7% |
5.0% |
11.4% |
-0.9% |
||||||
|
44 |
WASHINGTON-ARLINGTON-ALEXANDRIA, DC-VA-MD-WV |
0.5% |
2.3% |
13.4% |
-1.4% |
||||||
|
45 |
PITTSBURGH, PA |
0.2% |
5.5% |
13.5% |
-1.9% |
||||||
|
46 |
FRESNO, CA |
0.2% |
5.5% |
13.5% |
-1.9% |
||||||
|
47 |
PHOENIX-MESA-SCOTTSDALE, AZ |
1.1% |
8.1% |
11.2% |
-2.4% |
||||||
|
48 |
LOUISVILLE, KY-IN |
0.6% |
4.4% |
13.6% |
-4.2% |
||||||
|
49 |
DETROIT-WARREN-LIVONIA, MI |
1.5% |
11.0% |
16.1% |
-5.8% |
||||||
|
50 |
PROVIDENCE-NEWBEDFORD-FALL RIVER, RI-MA |
0.5% |
-0.6% |
13.8% |
-6.1% |
||||||
Chart 2. Top 50 Forecasted Metros – Data through December 2016. Source: Clear Capital®
“The market continues to move forward, yet the bumps of volatility still remain,” “In particular, the combined forces of increased mortgage rates, volatility in the equity markets, and the unfolding effects of TRID are likely to give consumers pause in taking an active role in housing in 2016. The psychological effects of the recent interest rate increase could have a more negative consequence in some markets than the actual rate hike itself, as buyers begin to question the decision to invest in the housing market at what looks like the end of a meteoric four-year growth cycle. This, coupled with the fact that several of the fastest-growing MSAs have already begun to slow down or stagnate even before the rate increase occurred, could spell trouble for the national housing market as a whole if overseas investors begin to look elsewhere for money-parking strategies. However, there are still attractive investment opportunities in at least one corner of the market; the lowest tier of the housing market still holds the most promise, as long as the potential home buyers of this market segment aren’t forced out due to the increasing cost to borrow,” said Villacorta.
“The long-term effects of some recent housing industry shake-ups are still out, but the models have reacted in a pessimistic way. With the nation projected to grow at a snail’s pace in some regions while virtually standing still in others, our models are taking into account the effects of the interest rate increase by the Fed in December 2015. Industry shocks like this have the potential to affect the market in unfavorable ways, lowering consumer confidence and instilling some level of doubt in the industry. While the real estate market is typically cold in January, it’s difficult to tell if the effects of these market changes have been realized quite yet. Until the market gets a chance to really heat up again—or not—in the spring, our models are staying consistent and forecasting a significant drop in growth for 2016,” Villacorta said.


One comment
Pingback: Clear Capital Puts a Chill in 2016 Price Forecasts | Belair Realty